Optimizing Your Investments with a Next.js-Powered Tool
Optimizing Your Investments with a Next.js-Powered Tool
Investing in today's fast-paced financial markets can be overwhelming, but with the right tools, you can gain clarity and make informed decisions to maximize your returns.
Our Next.js-based investment optimization tool
Our Next.js-based investment optimization tool is designed to empower users by providing real-time insights into their portfolios, covering stocks, cryptocurrencies, and more. Built with the latest web technologies, this tool offers a seamless, responsive, and efficient experience for both novice and experienced investors.
Real-Time Portfolio Tracking
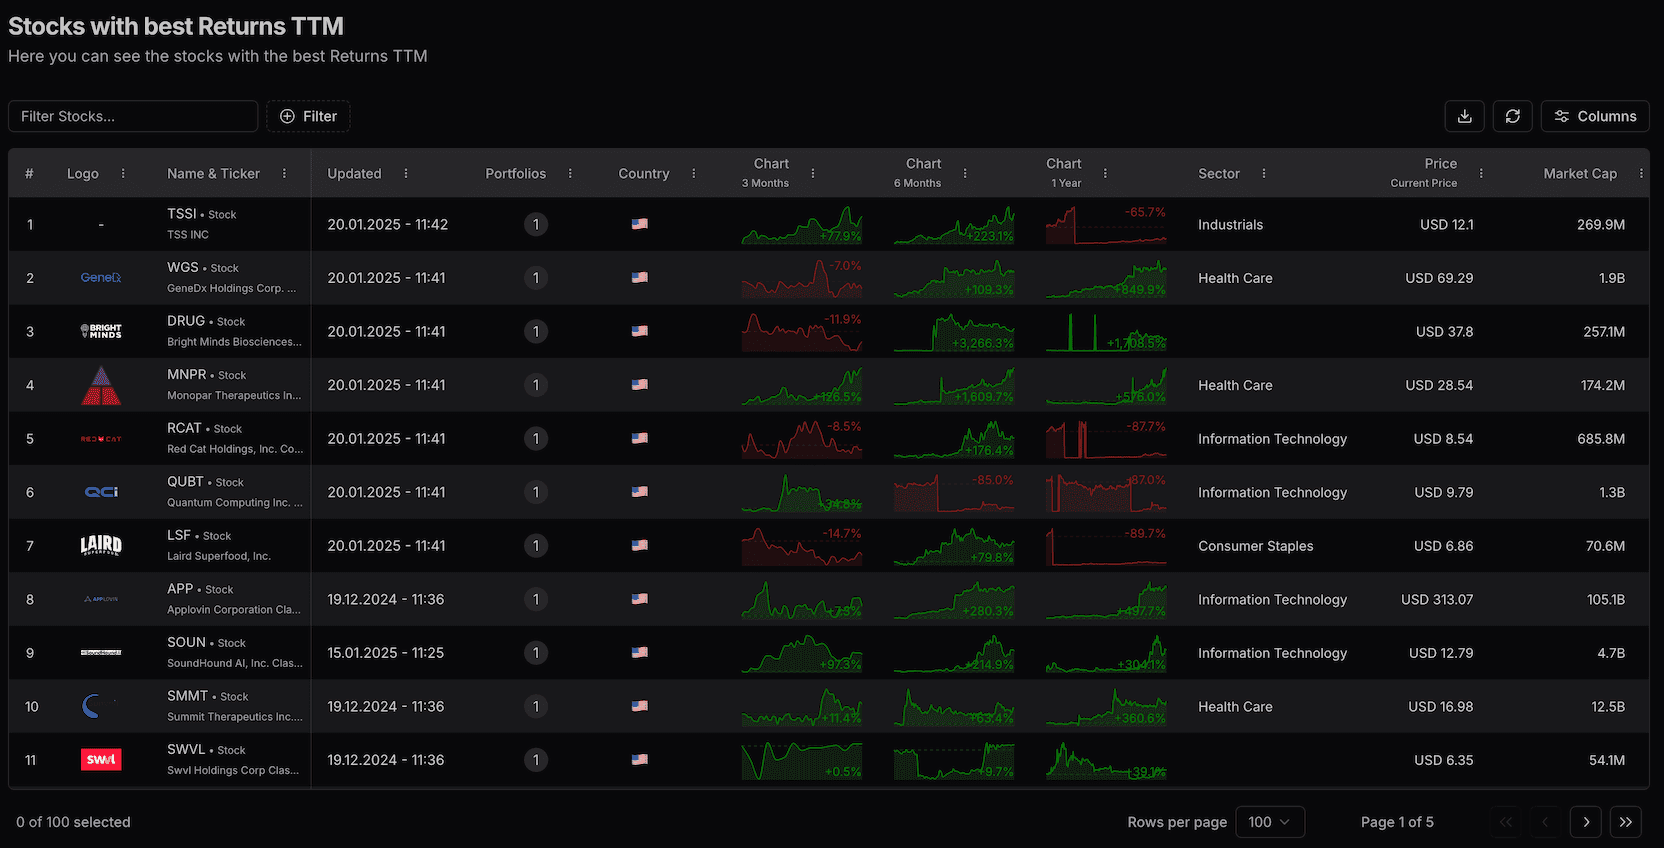
One of the core features of our tool is its ability to track your portfolio's performance in real time. As shown in Fig 1, you can visualize the historical performance of your investments over time, helping you identify trends and patterns.

The comprehensive overview shown in Fig 2 provides detailed insights into your portfolio's current state.

Comprehensive Portfolio Summary
Understanding the overall health of your investments is crucial, and our tool provides a detailed portfolio summary.
Snapshot of your portfolio
This snapshot, as shown in the "Holdings Summary," includes total portfolio value, daily changes, and year-to-date returns. It's an at-a-glance view that helps you quickly assess whether your strategy is on track or needs adjustment.

Detailed Holdings Analysis
For a deeper dive, our tool offers a comprehensive table of your holdings.
Granular view of your investments
The "Holdings Table" lists each asset in your portfolio, including ticker symbols, quantities, current values, and percentage changes. This granular view allows you to analyze individual investments and make data-driven decisions to optimize your returns.

Streamlined Order Management
Managing buy and sell orders is made simple with our intuitive order management system.
Efficient trade execution
The "Orders" interface lets you track and execute trades efficiently, ensuring you never miss an opportunity in the market. This feature integrates seamlessly with your portfolio, providing a holistic view of your investment activities.


Customizable Portfolios
Every investor is unique, and our tool supports customizable portfolios to match your specific goals and risk tolerance.
Diversify your investments
With options to create and manage multiple portfolios, as seen in the "Portfolios" interfaces, you can diversify your investments across different asset classes like stocks, crypto, and more. This flexibility ensures you can tailor your strategy to fit your financial objectives.


Visualizing Your Allocation
Understanding how your investments are distributed across asset classes is key to balancing risk and reward.
Multiple visualization options
Our tool offers multiple visualization options, including bar charts, pie charts, and treemaps, to represent your portfolio allocation. These visual tools, such as the "Holdings Allocation Bar," "Holdings Allocation Pie-2," and "Holdings Allocation Treemap," help you quickly grasp your exposure and make informed rebalancing decisions.


In-Depth Asset Insights
For each holding in your portfolio, our tool provides detailed insights to give you a complete picture.
Comprehensive data for evaluation
Whether it's financial metrics, historical performance, management team profiles, ownership structures, or company overviews, these detailed views—illustrated in the "Holdings Detail Financials," "Holdings Detail History," "Holdings Detail Management," "Holdings Detail Ownership," and "Holdings Detail Profile"—equip you with the data you need to evaluate and optimize your investments.
By leveraging the power of Next.js, our tool delivers a fast, scalable, and user-friendly platform that adapts to the dynamic nature of financial markets.
Your partner in financial success
Whether you're looking to grow your wealth, minimize risk, or explore new investment opportunities, this tool is your partner in achieving financial success as of February 2025.
Tech Stack
Interested?
Check out more projects in my portfolio or my projects, or let’s talk directly about your challenges: Contact.